

Global hurricane activity trending downward over the last 30 years
In this newsletter:
1) European satellites reveal global wildfires declining since 2003
Copernicus Atmosphere Monitoring Service (CAMS)
2) Global hurricane activity trending downward over the last 30 years
Perspecta Weather, 31 December 2020
6) Happy New Year! Start 2021 with renewed hope thanks to good climate-news stories
Global Warming Policy Forum, 31 December 2020
Perspecta Weather, 31 December 2020
3) England: No warming trend for 15 years
Paul Homewood, Not A Lot of People Know That, 2 January 2021
4) Global temperatures drop as La Nina kicks in
Roy Spencer blog, 2 January 2021
5) Distorting the view of our climate future: The misuse and abuse of climate pathways and scenarios
Roger Pielke Jr. and Justin Ritchie, Energy Research & Social Science
Volume 72, February 2021
6) Happy New Year! Start 2021 with renewed hope thanks to good climate-news stories
Global Warming Policy Forum, 31 December 2020
7) Ten climate predictions for 2020 that went horribly wrong
8) And finally: Half of Britons no longer trust biased BBC
The Times, 3 January 2021
Full details:
1) European satellites reveal global wildfires declining since 2003
Copernicus Atmosphere Monitoring Service (CAMS)
European satellite data show a generally decreasing trend since 2003, with 2020 one of the lowest years on record.
Copernicus Atmosphere Monitoring Service (CAMS)
European satellite data show a generally decreasing trend since 2003, with 2020 one of the lowest years on record.

2020 has been a year of extremes when it comes to wildfires. The Arctic and US saw record high levels of activity during the summer, whilst Canada and tropical Africa saw record lows. These lows have contributed to 2020 so far being one of the least active years since Copernicus Atmosphere Monitoring Service (CAMS*) records begin in 2003.
Every day, CAMS monitors wildfire activity around the world using satellite observations of fire radiative power (FRP) – a measure of the radiative heat output of the fires. The CAMS Global Fire Assimilation System (GFAS) then uses these satellite observations of the location and intensity of active wildfires to estimate emissions of a wide range of atmospheric pollutants.
In this article, we take a look at CAMS monitoring of fire activity over the last few months, covering the wildfire seasons in the western United States, central South America and tropical Africa.

Full story
2) Global hurricane activity trending downward over the last 30 years
Perspecta Weather, 31 December 2020
While the Atlantic Basin has had a record setting year in terms of tropical activity in 2020, “accumulated cyclone energy” was below-normal in the Northern Hemisphere and across the globe. Data courtesy Dr. Ryan Maue (http://climatlas.com/tropical/), NOAA
While the Atlantic Basin has had a record setting year in terms of tropical activity in 2020, “accumulated cyclone energy” was below-normal in the Northern Hemisphere and across the globe. Data courtesy Dr. Ryan Maue (http://climatlas.com/tropical/), NOAA

I charted global tropical cyclone ACE and see a slight downward trend over the past 30-years. Pretty surprising scientific result considering the narrative; Ryan Maue, 4 January 2021
Overview
The Atlantic Basin experienced the most active hurricane season on record with so many named storms (30) that the Greek alphabet had to be utilized for only the second time ever, the first being 2005. In fact, the 2020 Atlantic hurricane season was the fifth consecutive season with above-normal activity and 12 of the 30 named storms made landfall in the contiguous US, breaking the record of nine set in 1916. On the other hand, the Pacific hurricane season was well below normal in terms of overall activity with a total of 17 tropical storms and it was the least active year since 2010. The Pacific Ocean outweighs in importance the Atlantic Basin when it comes to global tropical activity which ends the year far below the normal levels of an important metric. In terms of tornado activity in the US during 2020, the year will end up below-normal and, fortunately, this year has featured no EF-5 tornadoes which are the most powerful of all.

Last 4-decades of Global Tropical Storm and Hurricane Accumulated Cyclone Energy -- Annual totals. The Southern Hemisphere tropical cyclone season occurs from July-June each calendar year. The graph is constructed such that SH annual value for July 2014 - July 2015 is positioned in 2015. Data courtesy Dr. Ryan Maue (http://climatlas.com/tropical/), NOAA, Paul Homewood (last updated 12/5/20).
2020 Global Tropical Activity
The 2020 Atlantic Basin hurricane season got off to an early start with the early formation of two tropical storms (Arthur and Bertha) in the month of May (the “official” hurricane season begins on June 1st.) This marked the sixth consecutive year with a “pre-season” system (in this case two systems) and it certainly was a sign that the year could turn out to be quite active. The record amount of activity in the Atlantic Basin for 2020 was fueled in part by La Nina conditions in the equatorial part of the Pacific Ocean. Typically, colder-than-normal sea surface temperatures in the tropical Pacific Ocean (i.e., La Nina conditions) lead to reduced overall wind shear in the tropical Atlantic Ocean and this, in turn, is a favorable factor for the formation and intensification of tropical cyclones in that part of the world.
The first hurricane in the 2020 Atlantic Basin season was named “Hanna” which made landfall in Texas during the latter part of July and this was followed by Hurricane “Isaias” which crossed the Bahamas and moved parallel to the east coasts of Florida and Georgia during early August. After a very active stretch for the next few weeks, Tropical Storm “Wilfred” formed during the middle of September and this was the last named storm before the Greek alphabet had to be utilized. In fact, there were eight systems named with Greek letters in subsequent weeks of the 2020 Atlantic Basin hurricane season ending with Hurricane “Iota” during the middle part of the month of November.

Global Hurricane Frequency (all & major) -- 12-month running sums. The top time series is the number of global tropical cyclones that reached at least hurricane-force (maximum lifetime wind speed exceeds 64-knots). The bottom time series is the number of global tropical cyclones that reached major hurricane strength (96-knots+). Adapted from Maue (2011) GRL. Data courtesy Dr. Ryan Maue (http://climatlas.com/tropical/), NOAA, Paul Homewood (last updated 11/30/20).
Full post

However this will be no more than an attempt to cover up the highly inconvenient truth, which is that warming stopped in 2006. The 10-year running average shows this clearly.

We can get a clearer picture of this by zooming in on the period since 1991. The 10-year average rose slowly during the 1990s and early 2000s. But since then they have gradually declined, having reached the peak for the 1997 to 2006 period:
Which all leads us around to the question of what is the “normal” climate for England?
The Met Office would say this is the 30-year average, but this is only an artificial construct for convenience. Currently the 10-year average on CET is 10.40C, which is barely above the 1991-2020 average of 10.25C. The difference is well within any margin of natural variation.
Full post
4) Global temperatures drop as La Nina kicks in
Roy Spencer blog, 2 January 2021
The Version 6.0 global average lower tropospheric temperature (LT) anomaly for December, 2020 was +0.27 deg. C, down substantially from the November, 2020 value of +0.53 deg. C.
 For comparison, the CDAS global surface temperature anomaly for the last 30 days at Weatherbell.com was +0.31 deg. C.
2020 ended as the 2nd warmest year in the 42-year satellite tropospheric temperature record at +0.49 deg. C, behind the 2016 value of +0.53 deg. C.
Cooling in December was largest over land, with 1-month drop of 0.60 deg. C, which is the 6th largest drop out of 504 months. This is likely the result of the La Nina now in progress.
The linear warming trend since January, 1979 remains at +0.14 C/decade (+0.12 C/decade over the global-averaged oceans, and +0.18 C/decade over global-averaged land).
Full post
5) Distorting the view of our climate future: The misuse and abuse of climate pathways and scenarios
Roger Pielke Jr. and Justin Ritchie, Energy Research & Social Science Volume 72, February 2021
Abstract
Climate science research and assessments under the umbrella of the Intergovernmental Panel on Climate Change (IPCC) have misused scenarios for more than a decade. Symptoms of misuse have included the treatment of an unrealistic, extreme scenario as the world’s most likely future in the absence of climate policy and the illogical comparison of climate projections across inconsistent global development trajectories. Reasons why such misuse arose include (a) competing demands for scenarios from users in diverse academic disciplines that ultimately conflated exploratory and policy relevant pathways, (b) the evolving role of the IPCC – which extended its mandate in a way that creates an inter-relationship between literature assessment and literature coordination, (c) unforeseen consequences of employing a temporary approach to scenario development, (d) maintaining research practices that normalize careless use of scenarios, and (e) the inherent complexity and technicality of scenarios in model-based research and in support of policy. Consequently, much of the climate research community is presently off-track from scientific coherence and policy-relevance. Attempts to address scenario misuse within the community have thus far not worked. The result has been the widespread production of myopic or misleading perspectives on future climate change and climate policy. Until reform is implemented, we can expect the production of such perspectives to continue, threatening the overall credibility of the IPCC and associated climate research. However, because many aspects of climate change discourse are contingent on scenarios, there is considerable momentum that will make such a course correction difficult and contested - even as efforts to improve scenarios have informed research that will be included in the IPCC 6th Assessment.
Full paper ($)
 A list of positive climate stories from the last 12 months
Full post
3) England: No warming trend for 15 years
Paul Homewood, Not A Lot of People Know That, 2 January 2021
Paul Homewood, Not A Lot of People Know That, 2 January 2021
New Met Office data for central England shows no warming trend since 2006


The annual data for 2020 has now been published for the CET, with the mean temperature ending up at 10.76C.

No doubt we will get the usual hysteria from the Met Office about the “third warmest year on record”, “nine of the ten warmest years since 1990”, blah, blah!
However this will be no more than an attempt to cover up the highly inconvenient truth, which is that warming stopped in 2006. The 10-year running average shows this clearly.

Which all leads us around to the question of what is the “normal” climate for England?
The Met Office would say this is the 30-year average, but this is only an artificial construct for convenience. Currently the 10-year average on CET is 10.40C, which is barely above the 1991-2020 average of 10.25C. The difference is well within any margin of natural variation.
Full post
4) Global temperatures drop as La Nina kicks in
Roy Spencer blog, 2 January 2021
The Version 6.0 global average lower tropospheric temperature (LT) anomaly for December, 2020 was +0.27 deg. C, down substantially from the November, 2020 value of +0.53 deg. C.

2020 ended as the 2nd warmest year in the 42-year satellite tropospheric temperature record at +0.49 deg. C, behind the 2016 value of +0.53 deg. C.
Cooling in December was largest over land, with 1-month drop of 0.60 deg. C, which is the 6th largest drop out of 504 months. This is likely the result of the La Nina now in progress.
The linear warming trend since January, 1979 remains at +0.14 C/decade (+0.12 C/decade over the global-averaged oceans, and +0.18 C/decade over global-averaged land).
Full post
Roger Pielke Jr. and Justin Ritchie, Energy Research & Social Science Volume 72, February 2021
Abstract
Climate science research and assessments under the umbrella of the Intergovernmental Panel on Climate Change (IPCC) have misused scenarios for more than a decade. Symptoms of misuse have included the treatment of an unrealistic, extreme scenario as the world’s most likely future in the absence of climate policy and the illogical comparison of climate projections across inconsistent global development trajectories. Reasons why such misuse arose include (a) competing demands for scenarios from users in diverse academic disciplines that ultimately conflated exploratory and policy relevant pathways, (b) the evolving role of the IPCC – which extended its mandate in a way that creates an inter-relationship between literature assessment and literature coordination, (c) unforeseen consequences of employing a temporary approach to scenario development, (d) maintaining research practices that normalize careless use of scenarios, and (e) the inherent complexity and technicality of scenarios in model-based research and in support of policy. Consequently, much of the climate research community is presently off-track from scientific coherence and policy-relevance. Attempts to address scenario misuse within the community have thus far not worked. The result has been the widespread production of myopic or misleading perspectives on future climate change and climate policy. Until reform is implemented, we can expect the production of such perspectives to continue, threatening the overall credibility of the IPCC and associated climate research. However, because many aspects of climate change discourse are contingent on scenarios, there is considerable momentum that will make such a course correction difficult and contested - even as efforts to improve scenarios have informed research that will be included in the IPCC 6th Assessment.
Full paper ($)
6) Happy New Year! Start 2021 with renewed hope thanks to good climate-news stories
Global Warming Policy Forum, 31 December 2020
Global Warming Policy Forum, 31 December 2020

At the end of the year, in an annual ritual of apocalyptic doom-mongering, climate campaigners howl that the last 12 months saw unprecedented extreme weather events — from heat waves and wildfires to floods and hurricanes — claiming these natural disasters are proof that climate disasters are getting worse.
Of course natural disasters have been happening for millions of years and continue to hit one part of the globe or another almost on a daily basis. What is really noteworthy, however, is that the number of people killed by climate-related disasters has been declining dramatically for the last 100 years – and by 15% in the last 20 years alone.
No wonder that weather disasters this year have already faded into memory as the Covid-19 pandemic has been dominating the news.
Here, we take a look at 12 encouraging climate news stories which our GWPF team covered during 2020.
1 - January: Global deaths from natural disasters drop to record low
Globally, in 2019, about 9,000 people lost their lives in natural catastrophes compared with 15,000 in 2018. This confirms the overall trend towards lower numbers of victims thanks to better prevention measures.
2 - February: Staying power of Kilimanjaro snow defies Al Gore’s gloomy forecast
Kilimanjaro has a habit of defying predictions. Some climate scientists had forecast that all of its ice fields and glaciers would have completely melted by now. Yet data suggests a number are stubbornly clinging on, albeit shrunken.
3 - March: Sea level rise was a constant phenomenon even before industrialisation, new study finds
A study by the University of York found evidence for a period of enhanced pre-industrial sea-level rise of about 2-3 millimetres per year in three locations — Nova Scotia, Maine and Connecticut, which were largely natural, without any human constructions or man-made factors.
4 - April: Earth Day at 50: None of its eco-doomsday predictions have come true
From predicting ecological collapse and the end of civilization to warnings that the world is running out of oil, all environmental doomsday predictions of the first Earth Day in 1970 have turned out to be flat out wrong.
5 - May: Scientists discover that coral reefs can adapt to warming ocean temperatures
Some coral reefs are adapting to warming ocean temperatures by making their own sunscreen in the form of bright neon colors — a strategy which invites coral animals to return to reefs and is seen as a critical adaptation to maintain healthy coral reefs around the world.
6 - June: Instead of extinction, Antarctic penguins could experience ‘population boom’ due to global warming
Antarctic penguins could experience a ‘population boom’ due to global warming as melting sea ice means they have to spend less time foraging for food.
7 - July: Siberian heatwaves are fairly common: Hottest summer on record was in 1917
There was nothing remotely exceptional about the heatwave at Verhojansk, with the hottest summer on record way back in 1917.
8 - August: No trend in hurricane activity in 167 years, new empirical study shows
Hurricane and major hurricane landfall counts exhibited no significant overall trend over 167 years of available data.
9 - September: Not scared: Research reveals “climate-complacency” across Europe
Most European citizens do not particularly care about climate change. That’s the striking finding from new research on the views of 70,000 randomly sampled European men and women. Only 5% described themselves as “extremely worried” about climate change. The climate and the environment ranked only fifth in people’s overall views about priorities.
10 - October: UN disasters report reveals big decline in climate-related disasters since 2000
A new United Nations report on The Human Cost of Disasters has been described as “an embarrassment” and “a catalogue of errors” after it emerged its headline claim of a “staggering rise in climate-related disasters” was refuted by its own data. The UNDRR’s own data shows that climate-related disasters have actually been declining for 20 years.
11 - November: New footage reveals Netflix faked walrus climate deaths
A GWPF video provides new evidence that the 2019 Netflix documentary film series, ‘Our Planet’, withheld facts behind the controversial walrus story it promoted as evidence of climate change.
12 - December: Scientists discover Arctic warming of Greenland ice sheet driven by geothermal activity
A team of researchers understands more about the melting of the Greenland ice sheet. They discovered a flow of hot rocks, known as a mantle plume, rising from the core-mantle boundary beneath central Greenland that melts the ice from below.
7) Ten climate predictions for 2020 that went horribly wrong
PJ Media, 28 December 2020
It seems climate armageddon has taken a permanent sabbatical.
It seems climate armageddon has taken a permanent sabbatical.
Many of those doomsday predictions specifically mentioned the annus horribilus of 2020. Those predictions also failed, some rather spectacularly.
Steve Milloy, a former Trump/Pence EPA transition team member and founder of JunkScience.com, compiled ten climate predictions for 2020 that fell far off the mark.
1. Average global temperature up 3 degrees Celsius
In 1987, the Star-Phoenix in Saskatoon, Saskatchewan, Canada, quoted James Hansen of NASA’s Goddard Institute for Space Studies in New York. His model predicted an average temperature increase of “between one-half and one degree Celsius by the end of the ’90s.”
And within 15 to 20 years of this, the earth will be warmer than it has been in the past 100,000 years,” Hansen said. According to the Star-Phoenix, his model predicted that “by the year 2020 we will experience an average temperature increase of around three degrees [Celsius], with even greater extremes.”
Milloy cited former NASA climatologist Roy Spencer, whose data suggest global temperatures have risen 0.64 degrees Celsius since 1987. The National Oceanic and Atmospheric Association (NOAA) shows an increase of about 0.5 degrees Celsius from 1987.
2. Global emissions
In 1978, The Vancouver Sun cited a paper in the journal Science. University of Washington researcher Minze Stuiver predicted that the concentration of CO2 in the atmosphere will have doubled by 2020.
We learn that if present trends continue, with economics the only limit on the exploitation of fossil fuels, the CO2 concentration will have doubled by 2020. Forty to 80 years after fuel burning peaks — that will come mid-century — the CO2 concentration will be five to 10 times its present level.”
Yet the CO2 in the atmosphere hasn’t come close to doubling since 1978. According to NOAA, in March 1978 when the Sun published this article, there were 335 parts per million of CO2 in the atmosphere. In February 2020, NOAA reported 413 parts per million in the atmosphere. That represents an increase of 23 percent, a far cry from doubling the concentration (which would be 670 parts per million).
3. Emissions from India and China
In December 2009, The Springfield News-Leader reported that India and China had pledged to cut emissions by 2020. “The developing world, for the first time, is offering its own actions — not straight reductions, but clean-energy projects and other steps to slow the growth of their emissions.”
China says it will, by 2020, reduce gases by 40 to 45 percent below ‘business as usual,’ that is, judged against 2005 figures, for energy used versus economic input. India offers a 20 to 25 percent slowdown in emissions growth.”
While these projections were more promises than predictions, they fell wide of the mark. India and China increased their carbon emissions since 2005. According to the World Bank, India emitted 1.2 million kilotons of CO2 in 2005 and 2.4 million kilotons of CO2 in 2018, the last year data is available, a 200 percent increase. China, meanwhile, emitted 5.9 million kilotons in 2005 and 9.9 million kilotons in 2016, a 168 percent increase.
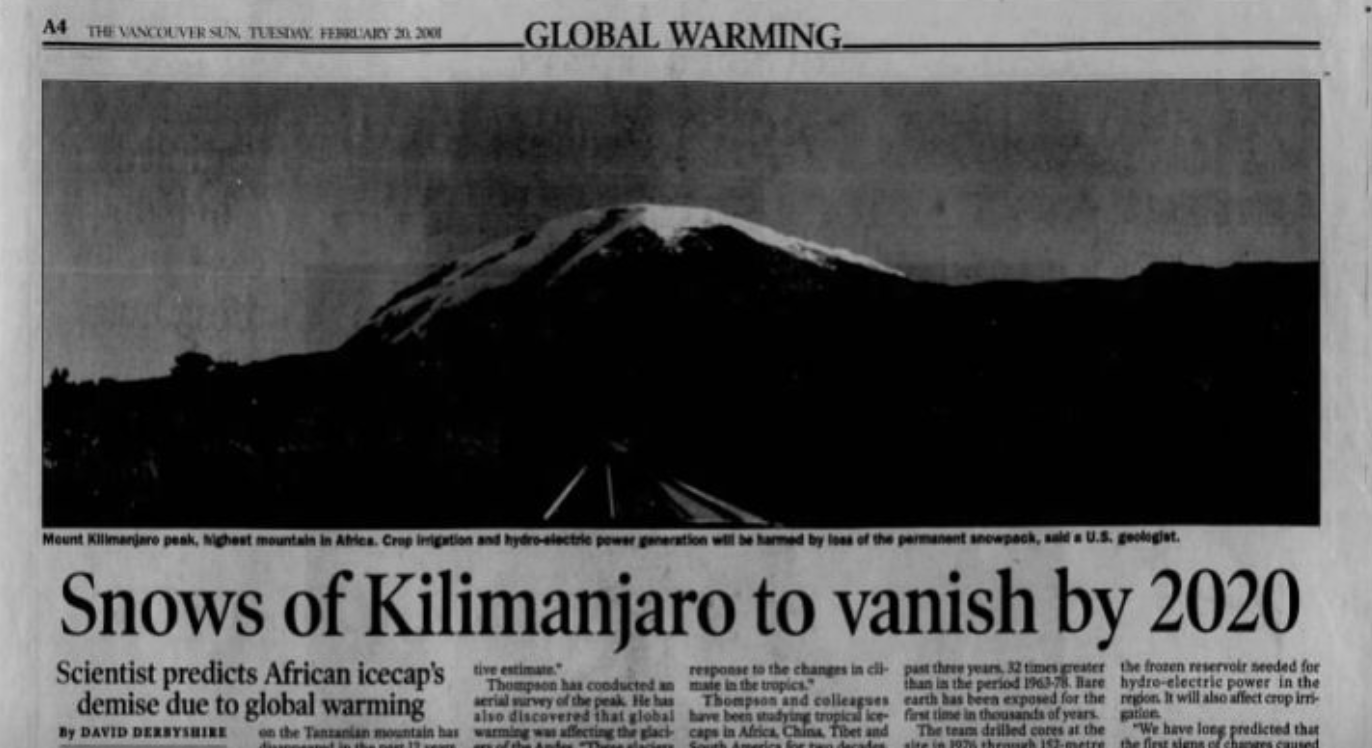
4. No snow on Mount Kilimanjaro
In 2001, The Vancouver Sun reported,
"Snows of Kilimanjaro to vanish by 2020.”
“At this rate, all of the ice will be gone between 2010 and 2020,’ said Lonnie Thompson, a geologist at Ohio State University. ‘And that is probably a conservative estimate.”
Al Gore’s 2006 documentary An Inconvenient Truth also predicted that there would be no snow on Kilimanjaro in 2020.
Yet in February 2020, The Times of London reported that the “Staying power of Kilimanjaro snow defies Al Gore’s gloomy forecast.”
“The snow has certainly got my clients talking,” Methley Swai, owner of the Just-Kilimanjaro trekking company, told The Times. “Many people have made Kilimanjaro a bucket list priority because of the Al Gore deadline but when they get here they are pleasantly surprised to find lots of snow.”
Full post
8) And finally: Half of Britons no longer trust biased BBC
The Times, 3 January 2021
Nearly half of Britons think that the BBC no longer represents their values amid declining levels of trust in the broadcaster, particularly outside London, research for The Times suggests.
The Times, 3 January 2021
Nearly half of Britons think that the BBC no longer represents their values amid declining levels of trust in the broadcaster, particularly outside London, research for The Times suggests.

In the past year a third of the public said that the values of the BBC had become less like theirs amid controversy over its coverage of Brexit and the pandemic. Only 33 per cent now believe that it represents their standpoint.
Government research in 2016 found that 62 per cent of the public had an overall favourable view of the BBC.
The results are understood to chime with the unpublished research recently conducted by the BBC which found that residents of well-off and diverse neighbourhoods held the broadcaster in higher esteem than people from poorer and less diverse communities.
The findings also tally with an Ofcom report in November which said that the BBC’s bedrock older middle-class audience was going off it. The report added that it was seen as the least impartial public service broadcaster, below ITV, Channel 4, Sky and Channel 5. Fifty-four per cent of adults believe that it provides impartial news.
Full story (£)
The London-based Global Warming Policy Forum is a world leading think tank on global warming policy issues. The GWPF newsletter is prepared by Director Dr Benny Peiser - for more information, please visit the website at www.thegwpf.com.

No comments:
Post a Comment
Thank you for joining the discussion. Breaking Views welcomes respectful contributions that enrich the debate. Please ensure your comments are not defamatory, derogatory or disruptive. We appreciate your cooperation.