

New Zealand’s March quarter gross domestic product (GDP) figures, which will have an important influence on the upcoming general election, were released this week.
Although the June quarter figures will be released on September 21, two days before the election, the March quarter figures will receive most of the political attention. This is because the National Government will boast about its great economic management while the opposition parties will argue that the benefits of our recent economic success have not been evenly distributed.
GDP growth rates also have a significant influence on New Zealand’s net migration, which is expected to be a major issue during the election campaign.
The first point to note is that the country’s economic activity, as measured by real GDP on a seasonally adjusted basis, expanded by 0.5 per cent in the March quarter compared with the December 2016 quarter. This was slightly below the consensus forecast growth of 0.7 per cent but was better than most other developed countries.
For example, Australia and United States both reported 0.3 per cent GDP growth for the same period, while the UK economy grew by only 0.2 per cent.
The euro area expanded by 0.6 per cent in the March quarter while the 35 OECD countries grew by 0.4 per cent compared with the December quarter.
The top performing New Zealand sector in the March quarter was agriculture, forestry and fishing, which grew by 2.8 per cent, and the weakest was construction, which contracted by 2.1 per cent.
Agriculture was a major positive contributor to the March quarter because of increased milk production, following two consecutive negative quarters. According to Statistics NZ “dairy product manufacturing was a key contributor to the increase in food, beverage and tobacco manufacturing”.
Construction activity fell across a wide range of areas in the March quarter, with residential building down 1.6 per cent compared with the previous quarter, non-residential activity declining 7.9 per cent and other construction off 3.1 per cent.
These negative figures followed a 1.4 per cent increase in total construction activity for the December 2016 quarter and a 9.3 per cent rise in the March 2017 year compared with the March 2016 year.
Bank economists were relatively neutral on the March quarter figures with ANZ noting that although the “result is a clear disappointment, we don’t believe it is a true reflection of growth momentum across the economy at present”.
Westpac believes that “today’s GDP result (0.5 per cent), which once again fell significantly short of the RBNZ’s forecast (0.9 per cent), will only reinforce the RBNZ’s view that the need for interest rate hikes is a long way off”.
ASB remains “confident in the medium-term growth outlook, which will be supported by high terms of trade, low interest rates and population growth” and expects “the RBNZ to leave the OCR on hold at 1.75 per cent until late-2018”.
Finally, BNZ is “not down in the mouth about today’s reported 0.5 per cent expansion in March quarter GDP” and there was “nothing to perturb our expectation of next quarter’s (Q2) GDP growth, which remains at 0.8 per cent”.
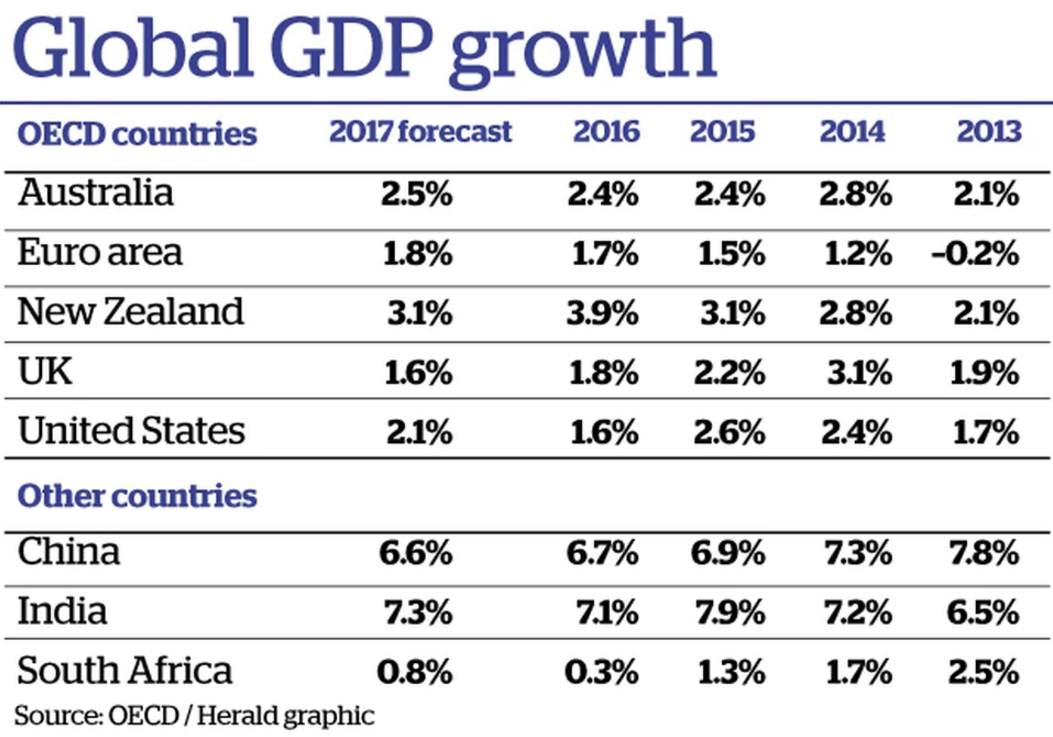
New Zealand’s March quarter GDP figures were below expectations but the country’s economic growth has been well above most other developed countries in recent years, as illustrated by the accompanying table.
The country’s 3.9 per cent growth rate in 2016, and forecast 3.1 per cent for the current year, compares with 1.8 per cent and 2.1 per cent respectively for total OECD countries. New Zealand’s recent GDP growth rates have been clearly superior to Australia, the euro area, United Kingdom and United States.
Between 2002 and 2016, Australia, Israel, Korea and Poland were the only OECD countries to have positive GDP growth every year but New Zealand was not far off as it has had only one negative year, a minus 0.4 per cent figure in 2008.
The latest OECD Economic Outlook, which was released on June 7, is relatively upbeat.
The Paris-based organisation is forecasting world economic growth to increase to 3.5 per cent this year compared with 3.0 per cent last year.
This includes a forecast increase in India’s economic growth while the Brazilian economy is expected to transition from a negative 3.6 per cent growth rate in 2016 to a positive 0.7 per cent this year.
OECD growth, which doesn’t include China, India, Brazil or South Africa, is forecast to increase from 1.8 per cent last year to 2.1 per cent in the current year.
The OECD’s optimism is based on a number of factors, including an increase in global confidence, investment and trade, higher growth in commodity-producing countries, rising demand for high-tech goods and increased capital investment.
The OECD is forecasting New Zealand’s GDP growth to ease to 3.1 per cent in the current year as net immigration is expected to fall, household consumption to ease, while the wind-down of the Canterbury earthquake rebuild will impact on the construction sector.
The OECD supports New Zealand’s flexible labour market but believes that we need to strengthen the country’s education and training systems to help people acquire the skills that are in demand.
Although New Zealand’s economic growth is expected to slow this year, it should be well ahead of other OECD countries, including Australia.
Economic growth has an important impact on net migration as labour is becoming increasingly mobile and high-skilled individuals move to countries with attractive job opportunities. This is particularly true as far as movements between New Zealand and Australia are concerned because labour can move freely between the two countries.
Australia was the main source of New Zealand’s permanent and long-term immigration in the year to April 2017, with 25,460 arrivals from that country. It was followed by 14,968 arrivals from the United Kingdom, 12,380 from China, 9,393 from India and 5,018 from South Africa.
Long-term arrivals from Australia are high because job creation across the Tasman has been low compared with New Zealand.
Since the end of 2012 total seasonally-adjusted employment has increased by only 5.9 per cent in Australia compared with 15.8 per cent in New Zealand.
The situation looks even better on this side of the Tasman when we take a closer look at the figures.
In Australia, 65 per cent of the jobs created since December 2012 have been part-time compared with only 16 per cent in New Zealand and we have created 294,000 new full-time jobs over this period compared with only 235,000 in Australia. These are remarkable figures as Australia has 24.5 million inhabitants versus our 4.8 million.
These figures clearly demonstrate why fewer New Zealanders are moving across the Tasman and why more and more are coming home.
Migration from the United Kingdom also remains high because of its relatively low level of economic growth and political uncertainty, particularly after the Brexit vote.
Inflows from China and India are high even though both economies are growing strongly. These two countries have always been at the top of the world’s emigration table, along with Syria and Bangladesh.
South Africa remains a major source of long-term arrivals as far as New Zealand is concerned because of the country’s low GDP growth, 27.7 per cent unemployment rate and political instability.
Brian Gaynor
is an investment analyst and the Executive Director of Milford Asset
Management. This article originally appeared in the NZ Herald.

No comments:
Post a Comment
Thank you for joining the discussion. Breaking Views welcomes respectful contributions that enrich the debate. Please ensure your comments are not defamatory, derogatory or disruptive. We appreciate your cooperation.