The Reserve Bank’s Monetary Policy Statement yesterday seems to have caught the market on the hop. Such things would be less likely if (a) we had a better MPC, and (b) they actually communicated (speeches and the like). A steady flow of supporting empirical research might help as well. But immediate market surprises aren’t really my prime focus or interest.
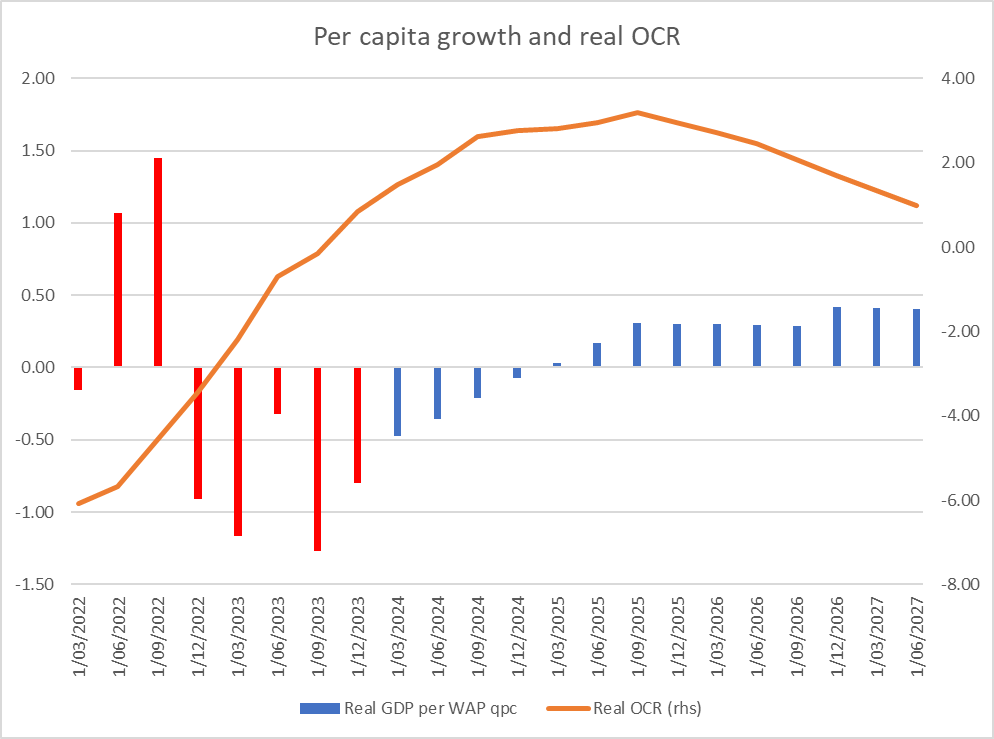
My interest is more in things like this, showing (all using RB forecast data)
- the real OCR (OCR less annual CPI inflation to that particular quarter)
- real GDP growth per working age population person (the RB doesn’t provide total population forecasts, so this is a proxy for per capita GDP growth). I’ve shown the actual data in red and the forecast data in blue.
Click to view
On the Reserve Bank’s projections, the OCR itself does not begin to be cut until the September quarter of next year (these forecasts once again push out any easing by another quarter or so). So even in nominal terms there is no monetary policy relief for another 15 months (and the exchange rate isn’t forecast to change either). Getting a good sense of real rates isn’t so easy. Inflation expectations never got as high as headline inflation, so those really deeply negative numbers on the left of my chart might be a little misleading. But….for the last year or so both inflation and measures of inflation expectations have been falling while the OCR has not: unquestionably, the real OCR has been rising further. On the Reserve Bank’s own numbers real interest rates seem set to increase further over the next 12-15 months (after all, most inflation expectations measures are influenced somewhat by recent experiences of inflation data).
So, real interest rates keep rising, and yet on the Reserve Bank’s telling the economy starts recovering, and by next September quarter is already back to generating real growth per WAP person of 0.3 per cent per quarter (annualised rate of about 1.2 per cent, which is hardly stellar but in an economy with basically no productivity growth in recent years certainly isn’t to be sniffed at – after all in the most recent year this measure of real GDP per capita has fallen by about 3.5 per cent)¹.
Where, you might wonder, is all this recovery in growth, to not-unrespectable levels, coming from? It is a good question. It isn’t from a stronger world economy (the assumptions the Bank is using there don’t show much change in growth rates), it isn’t going to be from looser fiscal policy (and certainly not on the dated numbers the Bank has to use, pending next week’s Budget), and as I noted it isn’t going to be from monetary policy (on the Bank’s numbers: rising real interest rates and an unchanged exchange rate). Fans of the government might mention its reform agenda etc etc, but…..there doesn’t seem to be much of one, and (more importantly here) the Bank doesn’t mention one as any sort of explanation. If anything, business confidence etc is weakening, with no sign of some contagious outbreak of animal spirits and associated entrepreneurship and investment. Oh, and the impulse to demand from the unexpected and very large surge in immigration isn’t going to be repeated (again on RB forecasts). The Bank’s forecasts have net migration halving from the rate experienced in the second half of last year.
The story just doesn’t ring true. I don’t think anyone doubts that the big increase in interest rates over the period to May last year (when the OCR got to the current 5.5 per cent) has played a significant part in the very weak economic performance of the New Zealand economy over the last 18 months (see chart). And we know – and the Reserve Bank often tells people – that there are non-trivial lags: monetary policy does not have its full effect on real economic activity anything like instantly, and a lag of perhaps 18 months is often cited. And although there is an argument that unexpected changes in interest rates might matter, no one really doubts that a persistent period of interest rates at any particular level (away from some conception of neutral, and these rates are above neutral on the Bank’s own telling) is going to have material economic impacts. So what is it that leads the Reserve Bank to think that we are now through the worst (of the GDP per capita contractions) and are on our way back to growth? I read the (very short) Economic Projections chapter in the Monetary Policy Statement and there was no hint of an explanation there either.
And then when the OCR does finally come down (in their projections) there isn’t much sign of a robust economic response to that either – unless the Bank thinks the lags are so long those effects won’t be seen until after mid-2027. But in that case, we’d be right back to the question: why do they think the economy is now about to pick itself up quite a lot from the deeply negative per capita GDP growth experience?
The story simply doesn’t seem to make a lot of sense. I’ve seen a few comments suggesting that the MPC is simply trying to bluff the markets – they don’t want to cut the OCR, and just needed some vaguely plausible headline numbers to back that preference. I’d be rather surprised if that was the real story, but when we have this immaculate recovery – even as monetary policy remains hostile, forecast immigration trends remain hostile, and fiscal policy is hardly supportive either – it is really hard to know quite what is going on.
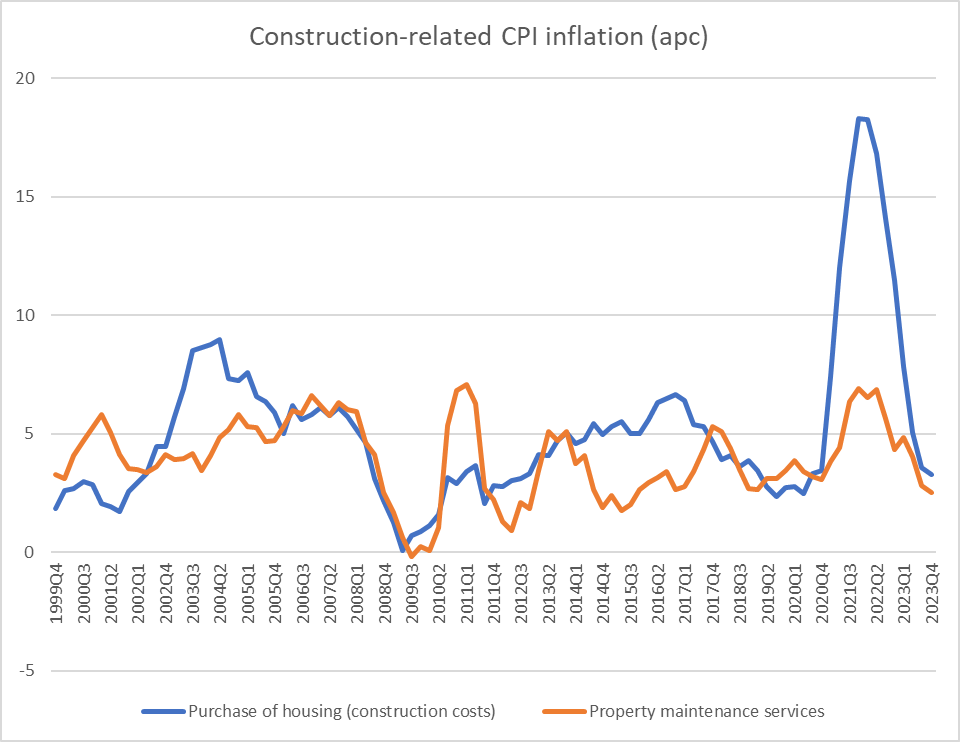
As for the inflation outlook itself, I’m not really persuaded it is quite as worrying as the Reserve Bank suggests. As a couple of straws in the wind recall that construction costs are among the most cyclical (and labour intensive) parts of the CPI, and residential construction activity is probably the most cyclically variable part of the economy. With inflation in those sectors now running below historical averages, it probably bodes well for inflation in other service sectors.
Perhaps the Bank is right to worry, but it would be more persuasive in doing so if (a) they had a more compelling economic story (see above), and b) they offered more analysis and forecasting of inflation in core or underlying terms. A fair bit of the discussion in New Zealand proceeds around a tradables vs non-tradables split (and in my time, decades ago, as forecasting manager at the RB I actually introduced the first such breakdown) but…it is very uncommon internationally, has had some use when (as in times past) the New Zealand exchange rate was very volatile, but may not shed much light especially when – as at present – the adverse idiosyncratic shocks (that monetary policy might reasonably look through) are very much concentrated in the so-called non-tradables sector. Here, I’m not thinking of relatively strong rent increases, which are clearly a function of domestic demand and supply pressures, but of local authority rates increases (which have many of the characteristics of any indirect tax shock) and of insurance increases, which seem to have only a limited amount to do with anything domestic at all (and not to domestic pressure on real resources) and much more to do with adverse shocks to global risk-bearing capacity etc. They are real hits to consumer purchasing power, but would almost certainly be filtered out in any forecast of, say, trimmed mean inflation. It is quite a curious gap in the Bank’s projections that they make no attempt to do such forecasts (by contrast, and for example, the RBA does).
¹ Over the last full economic cycle (2007Q4 to 2019Q4) real GDP per working age person increased at a median annual rate of 1.1 per cent.
Michael Reddell spent most of his career at the Reserve Bank of New Zealand, where he was heavily involved with monetary policy formulation, and in financial markets and financial regulatory policy, serving for a time as Head of Financial Markets. Michael blogs at Croaking Cassandra - where this article was sourced.


No comments:
Post a Comment
Thank you for joining the discussion. Breaking Views welcomes respectful contributions that enrich the debate. Please ensure your comments are not defamatory, derogatory or disruptive. We appreciate your cooperation.